Research Project at the Center for Sensing Solutions, EURAC Research in collaboration with Laimburg Research Center.
This project has received funding from the European Union’s Horizon 2020 research and innovation program under the Marie Skłodowska-Curie grant agreement No 894215.
Project Acronym: OB-VISLY
Project title: An Ontology-based Visual Analytics Approach to Big Data from Agricultural Monitoring Infrastructure
Project Number: 894215
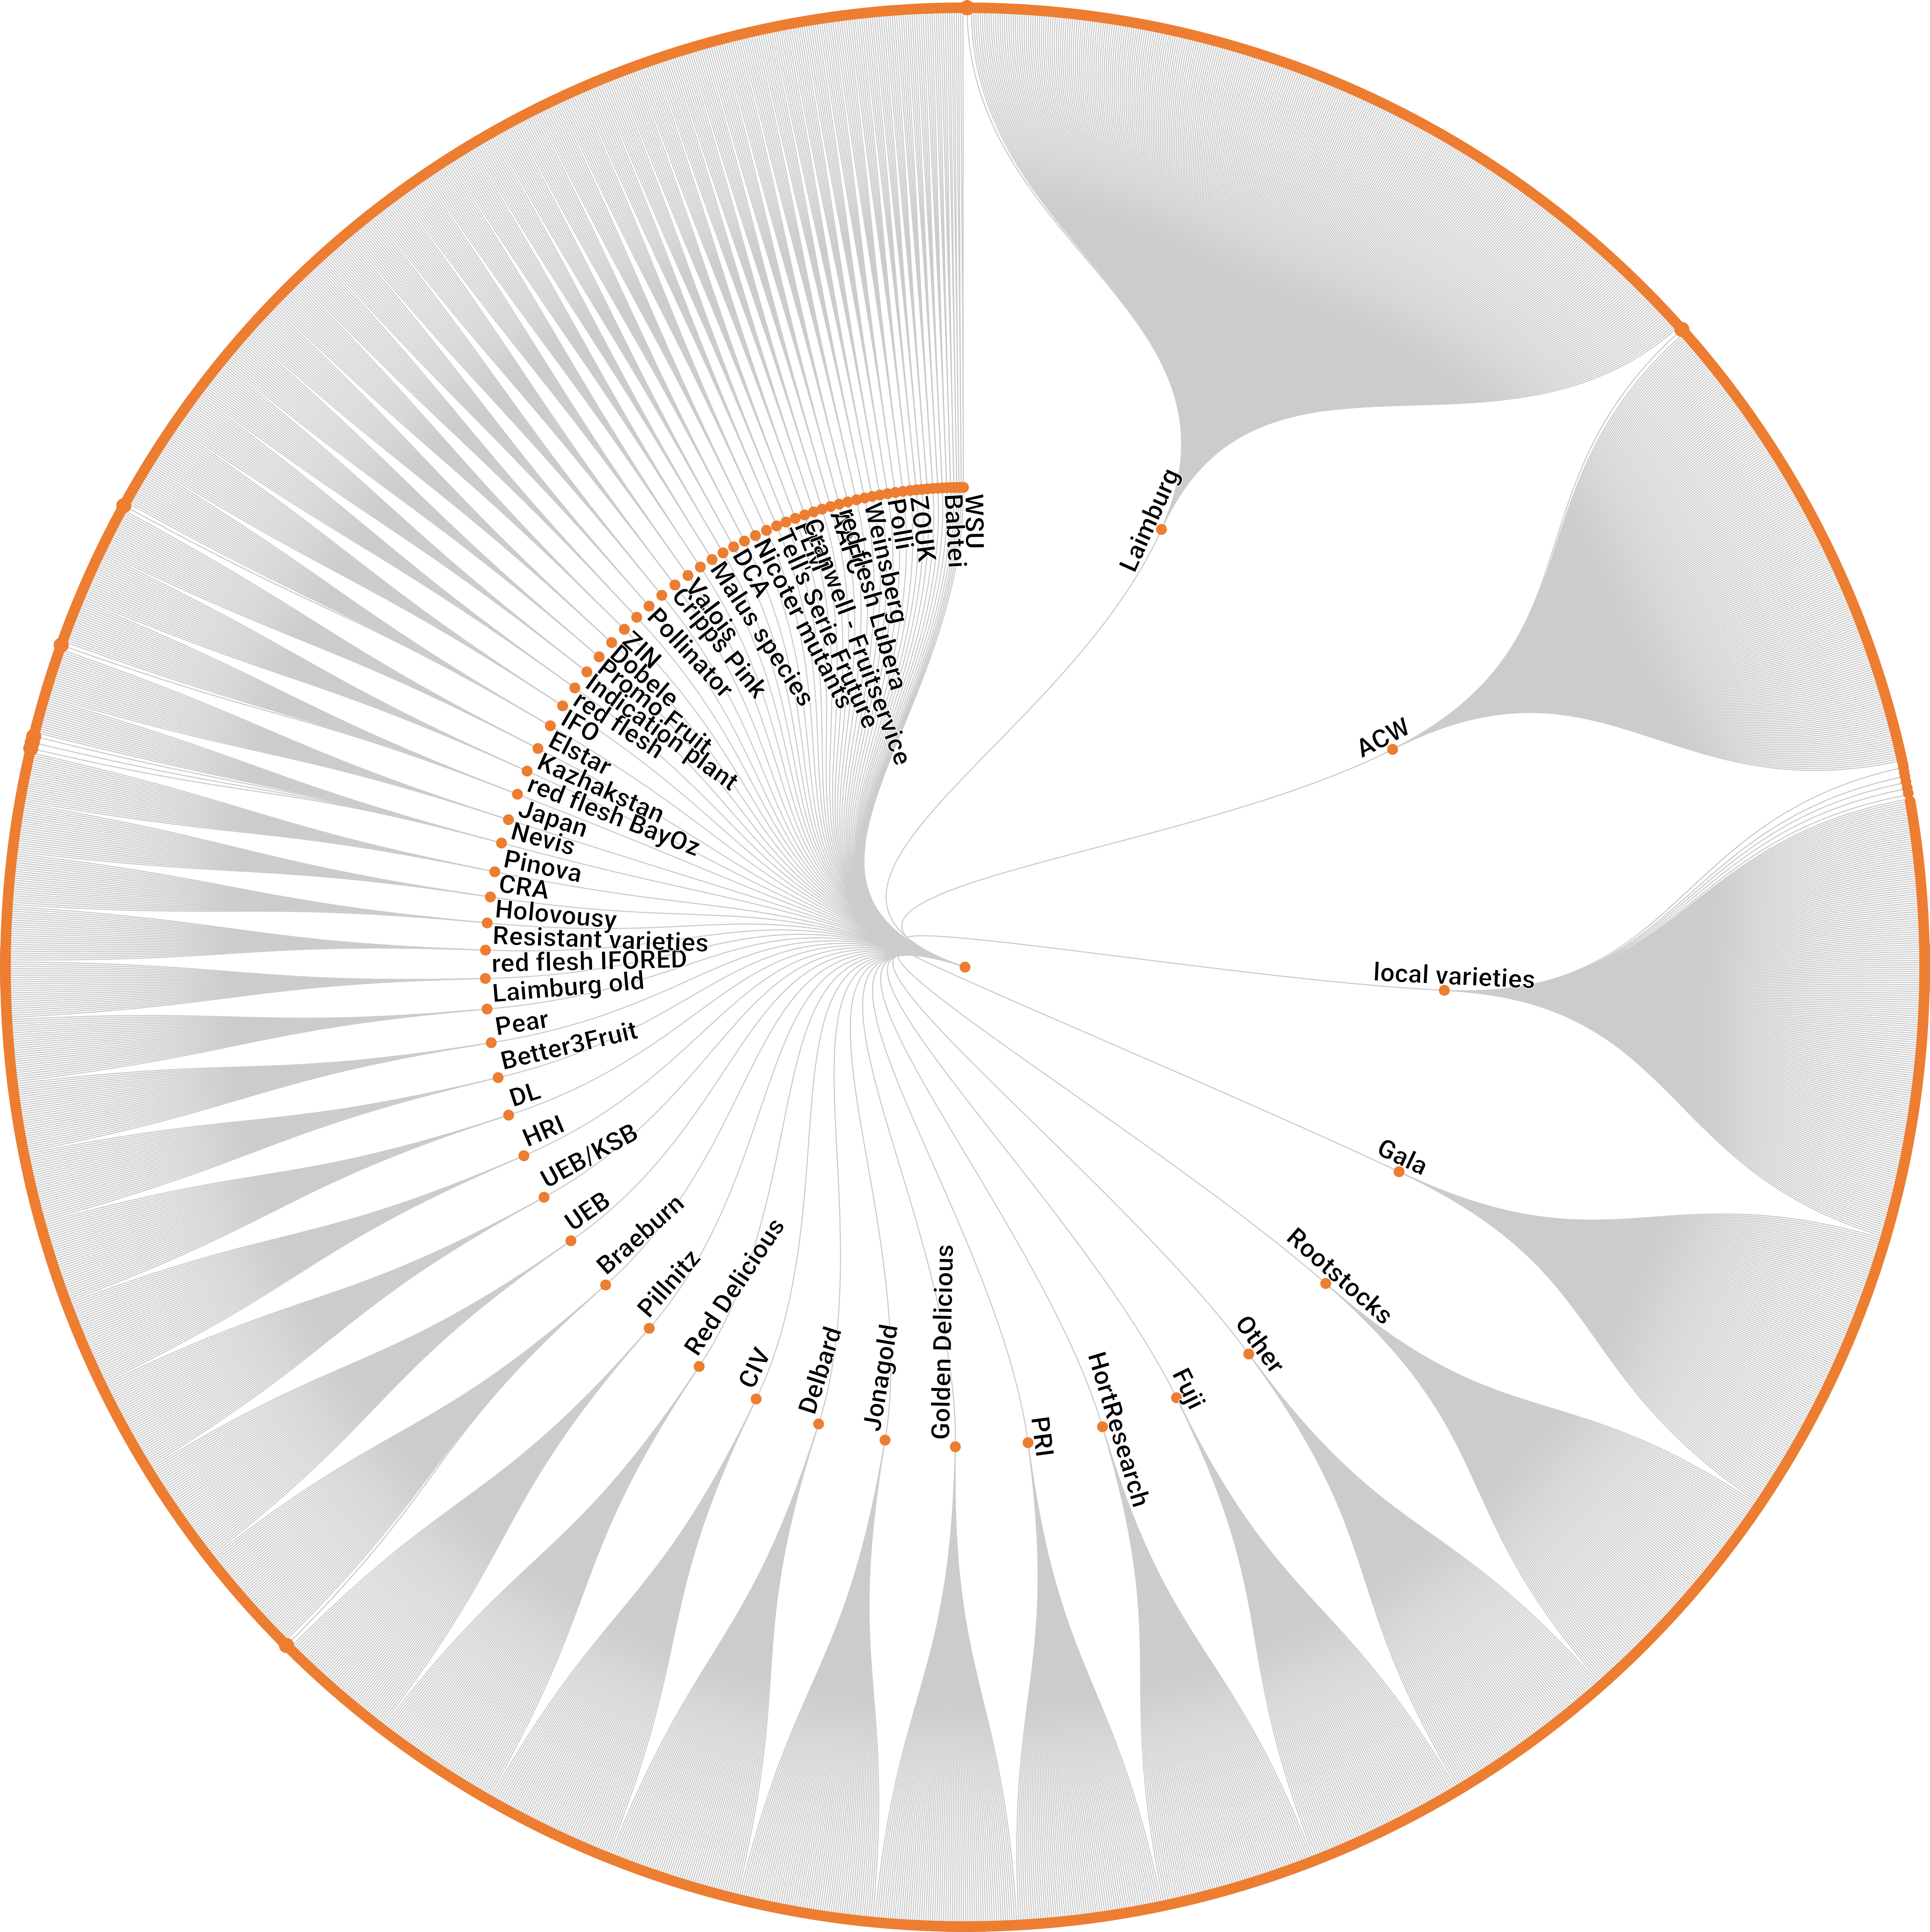
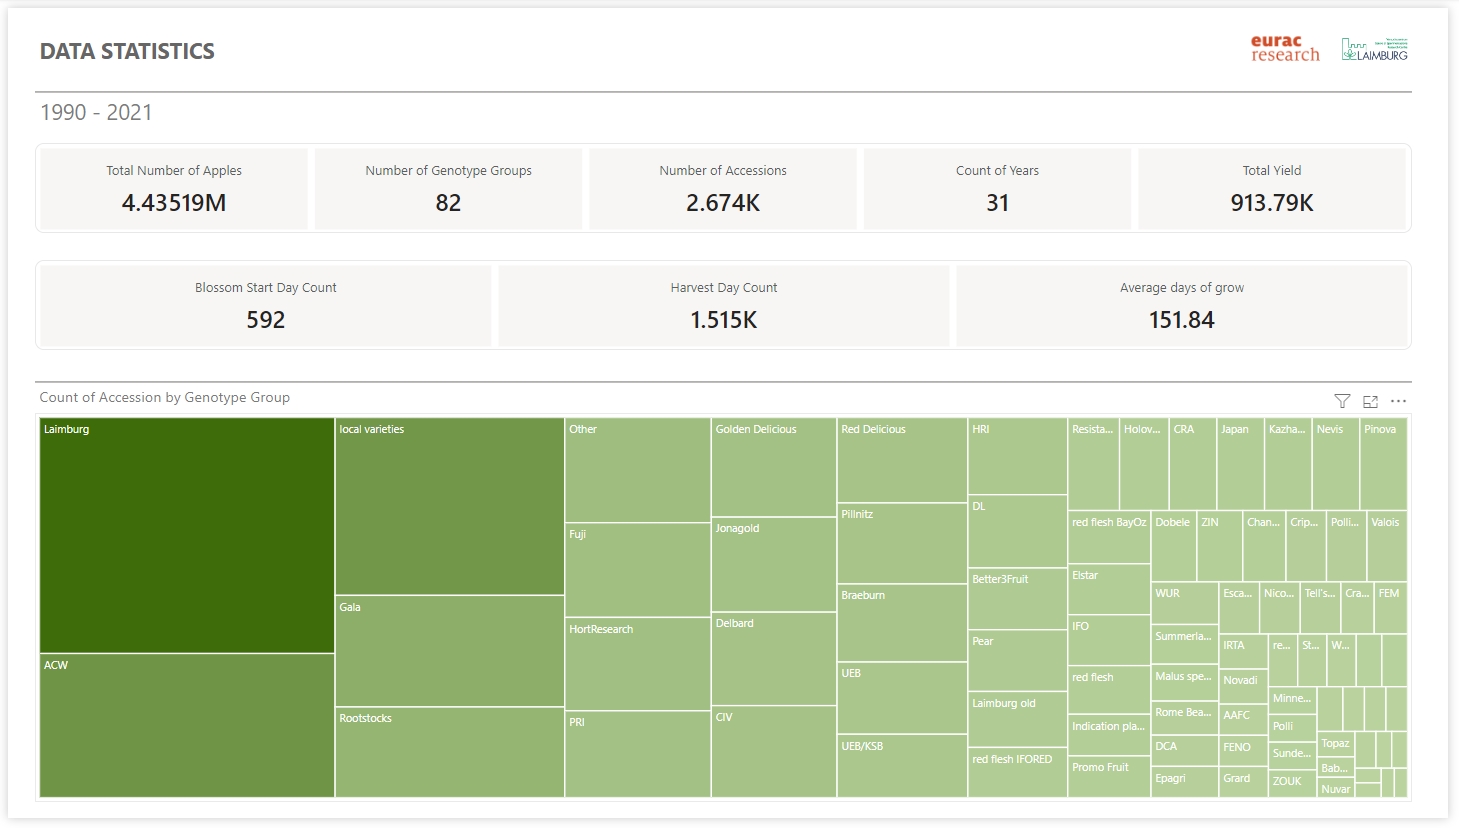
For the past 30 years, data on over 3,000 apple varieties and mutants have been meticulously collected, yet the existing Oracle database presented significant challenges in terms of navigation and analysis.
This limited the ability for apple breeders and researchers to efficiently compare and understand the relationship between apple variety performances and environmental factors, which was crucial for breeding and cultivation decision-making. The collected data encompasses:
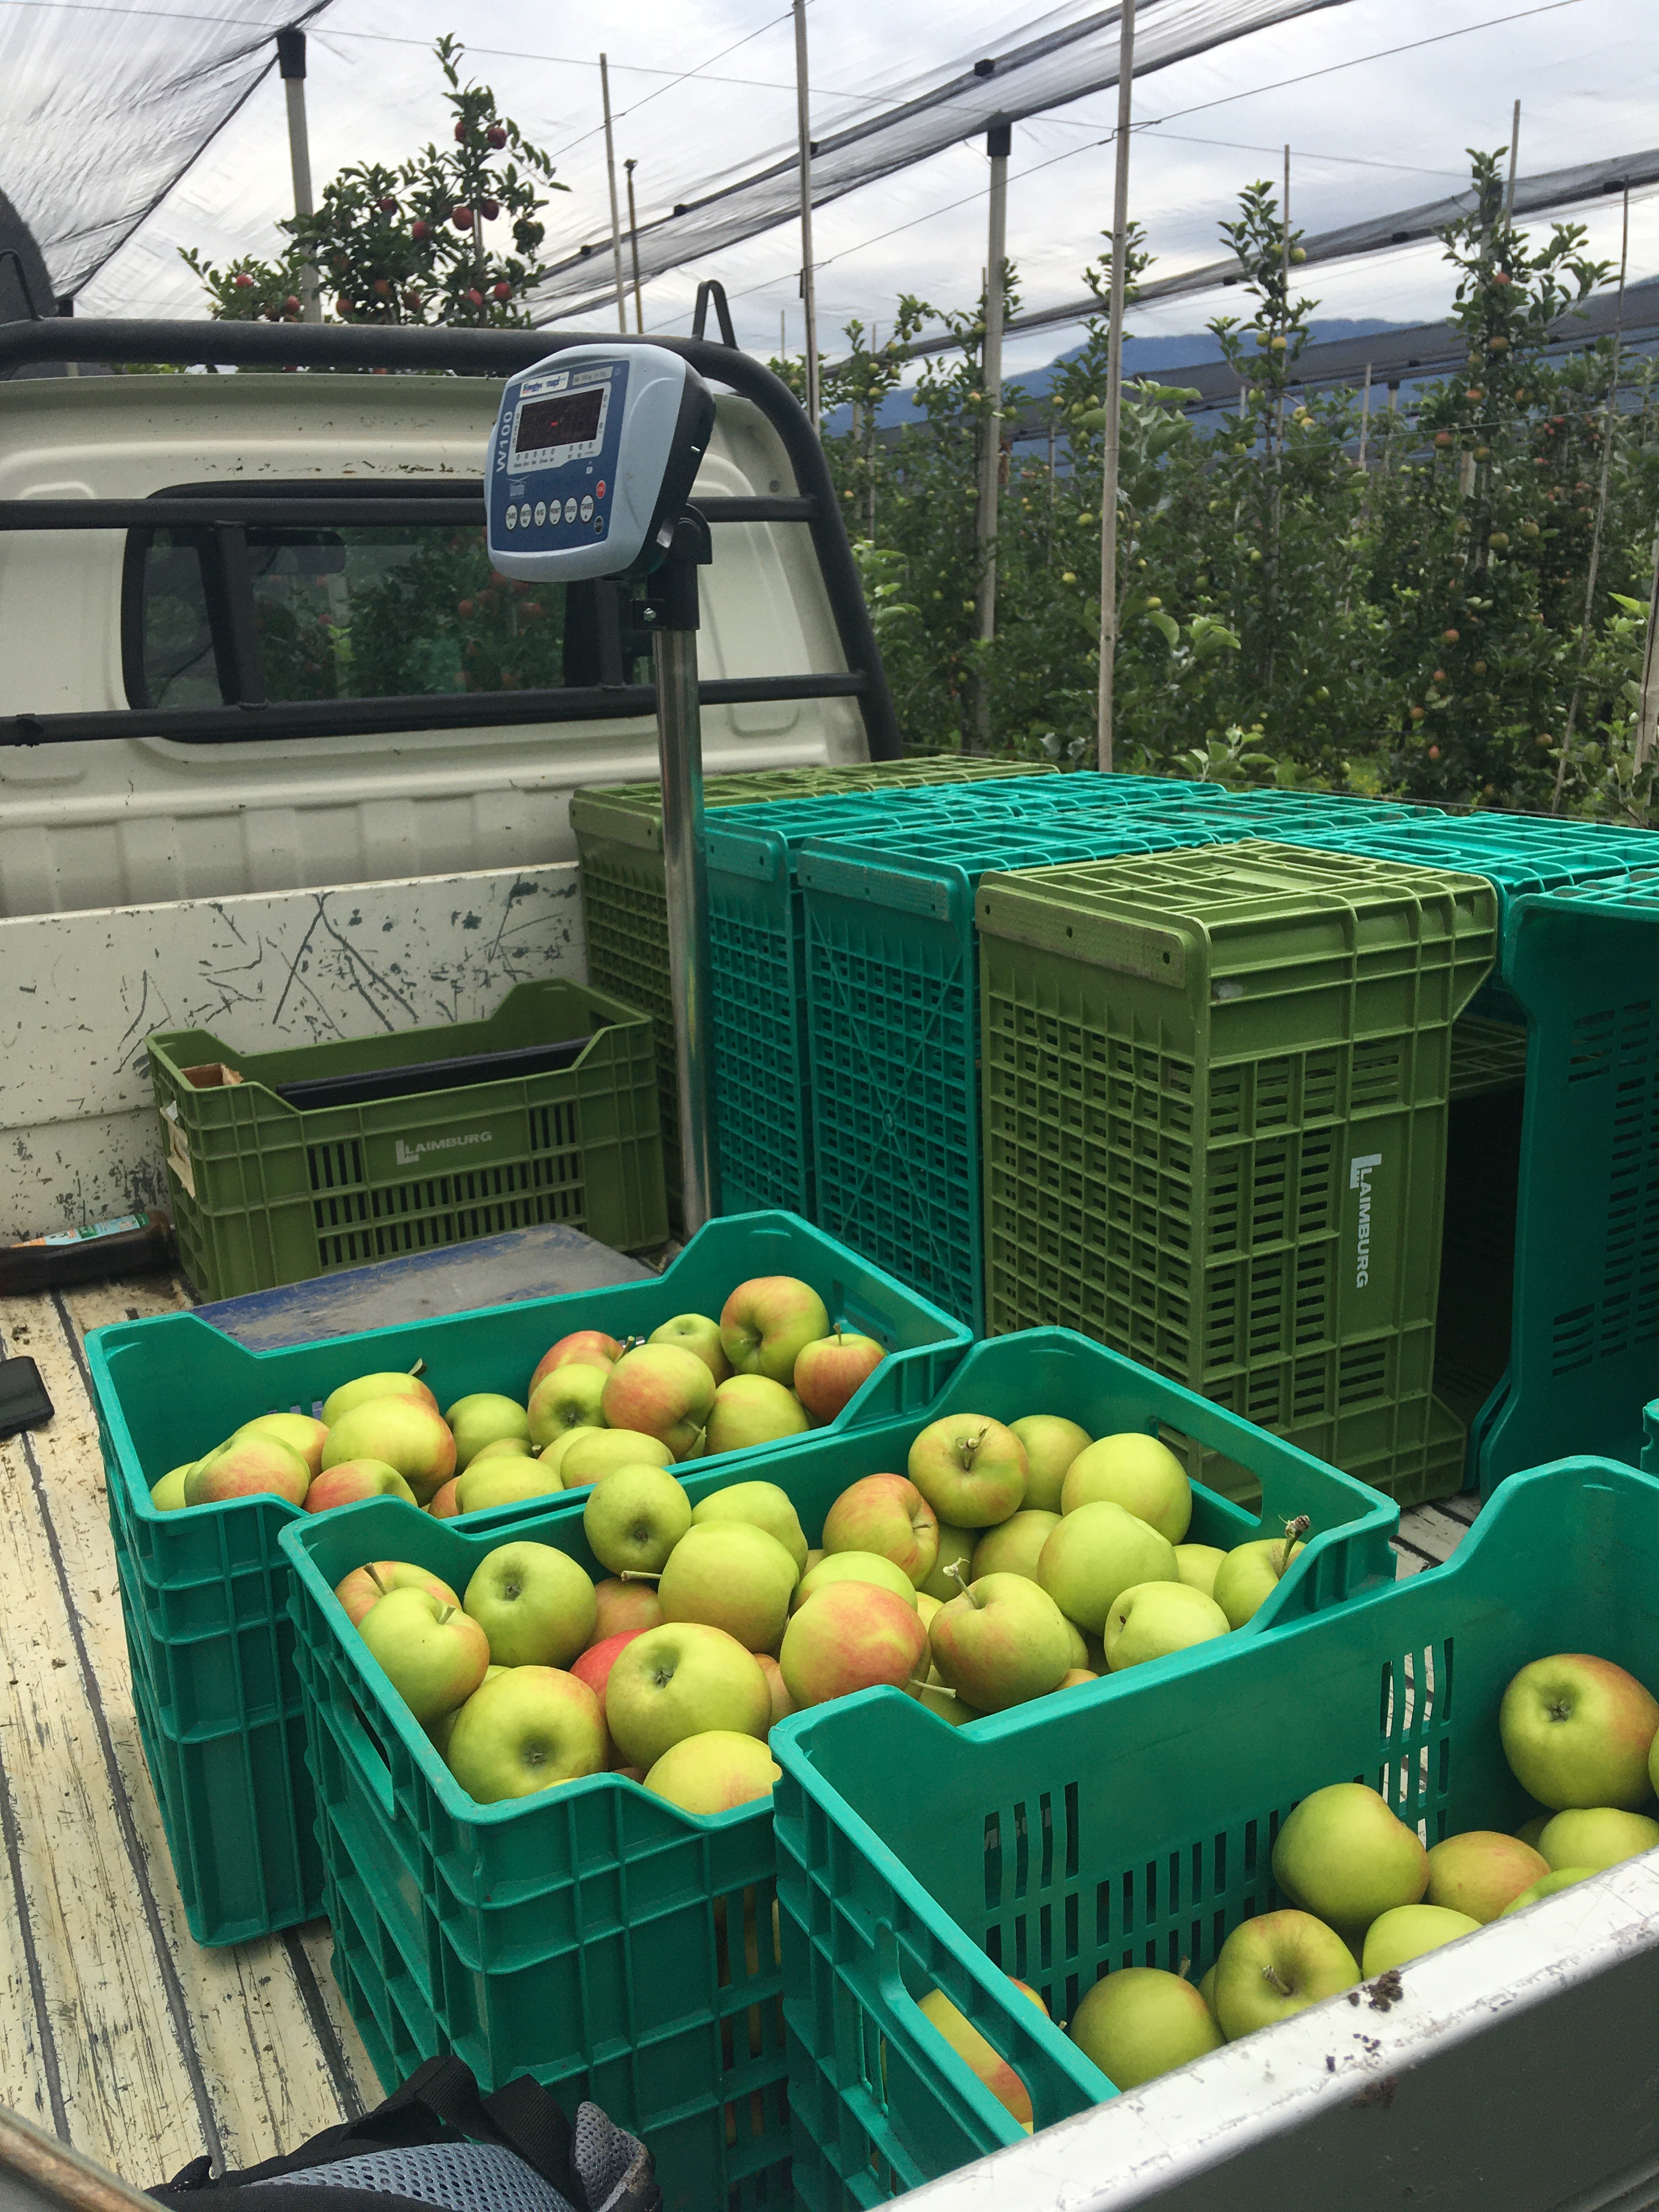
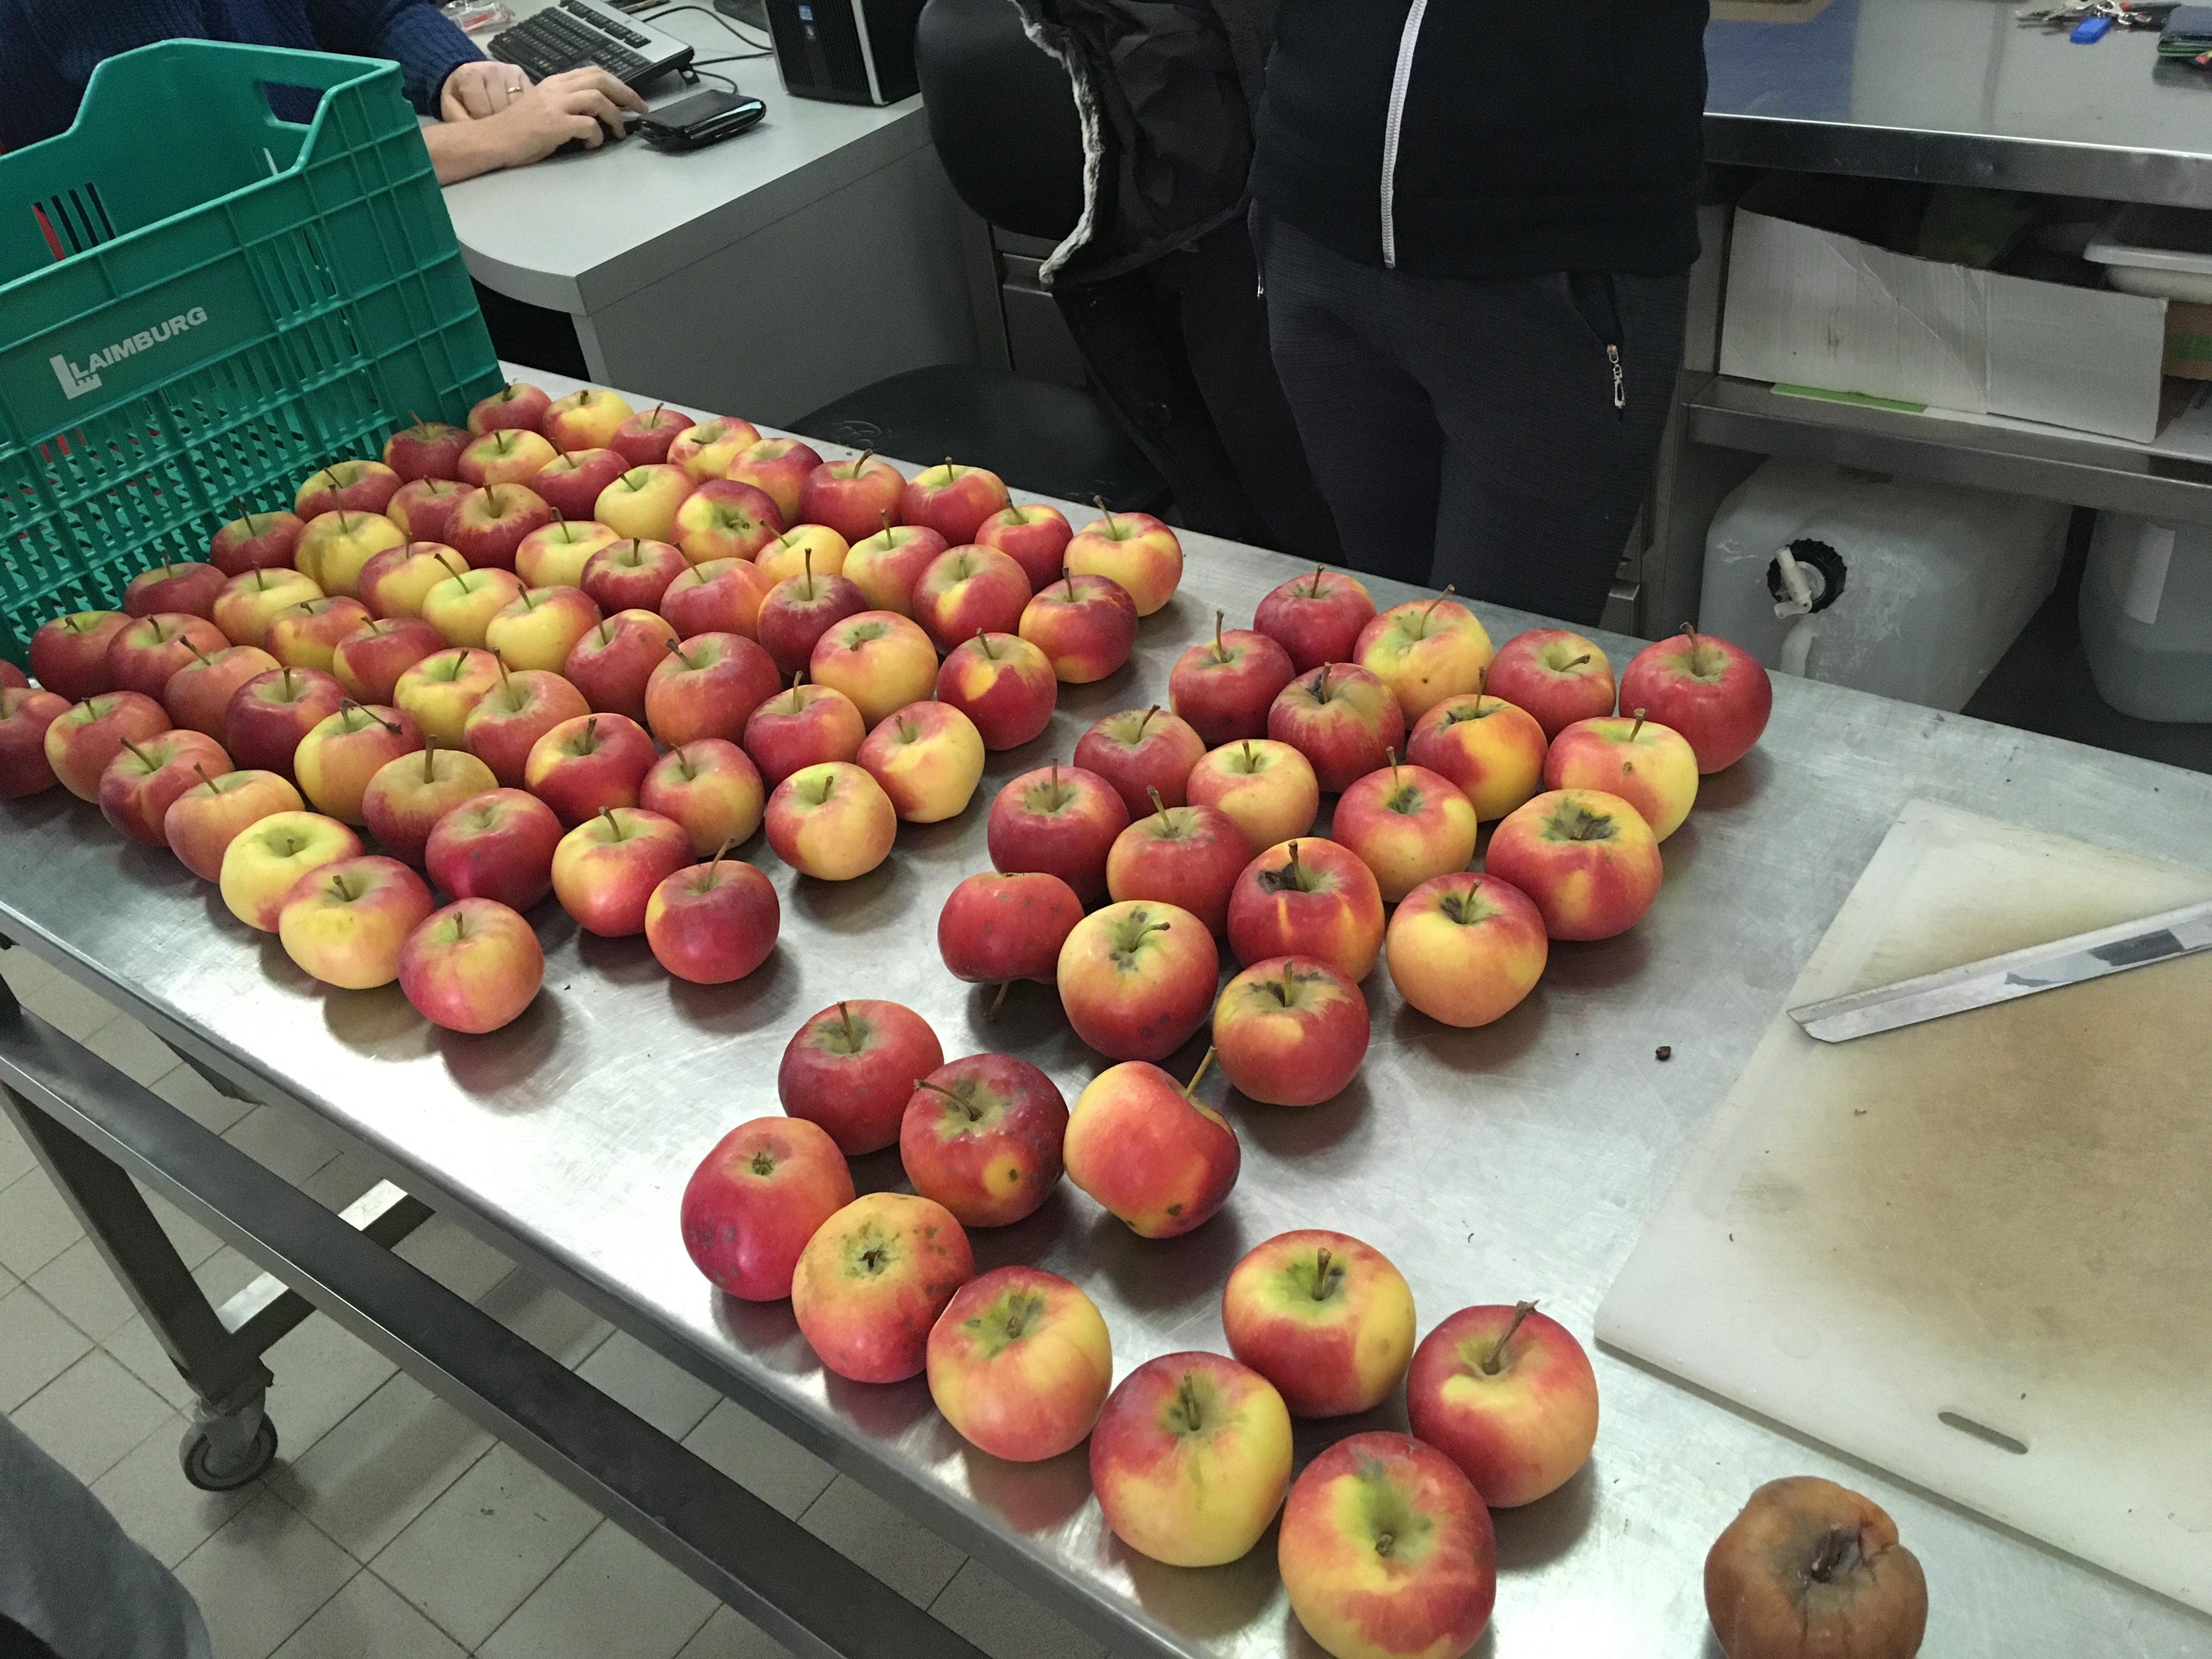
– Sorting metrics: Size and red color pigment percentage.
– Yield information and annual breeder descriptors for each variety.
– Quality characteristics: Acidity, starch, firmness, and sugar levels, evaluated at harvest and post-storage.
– Storage outcomes: Impact of conditions and pathologies, such as mould or bitter pit.
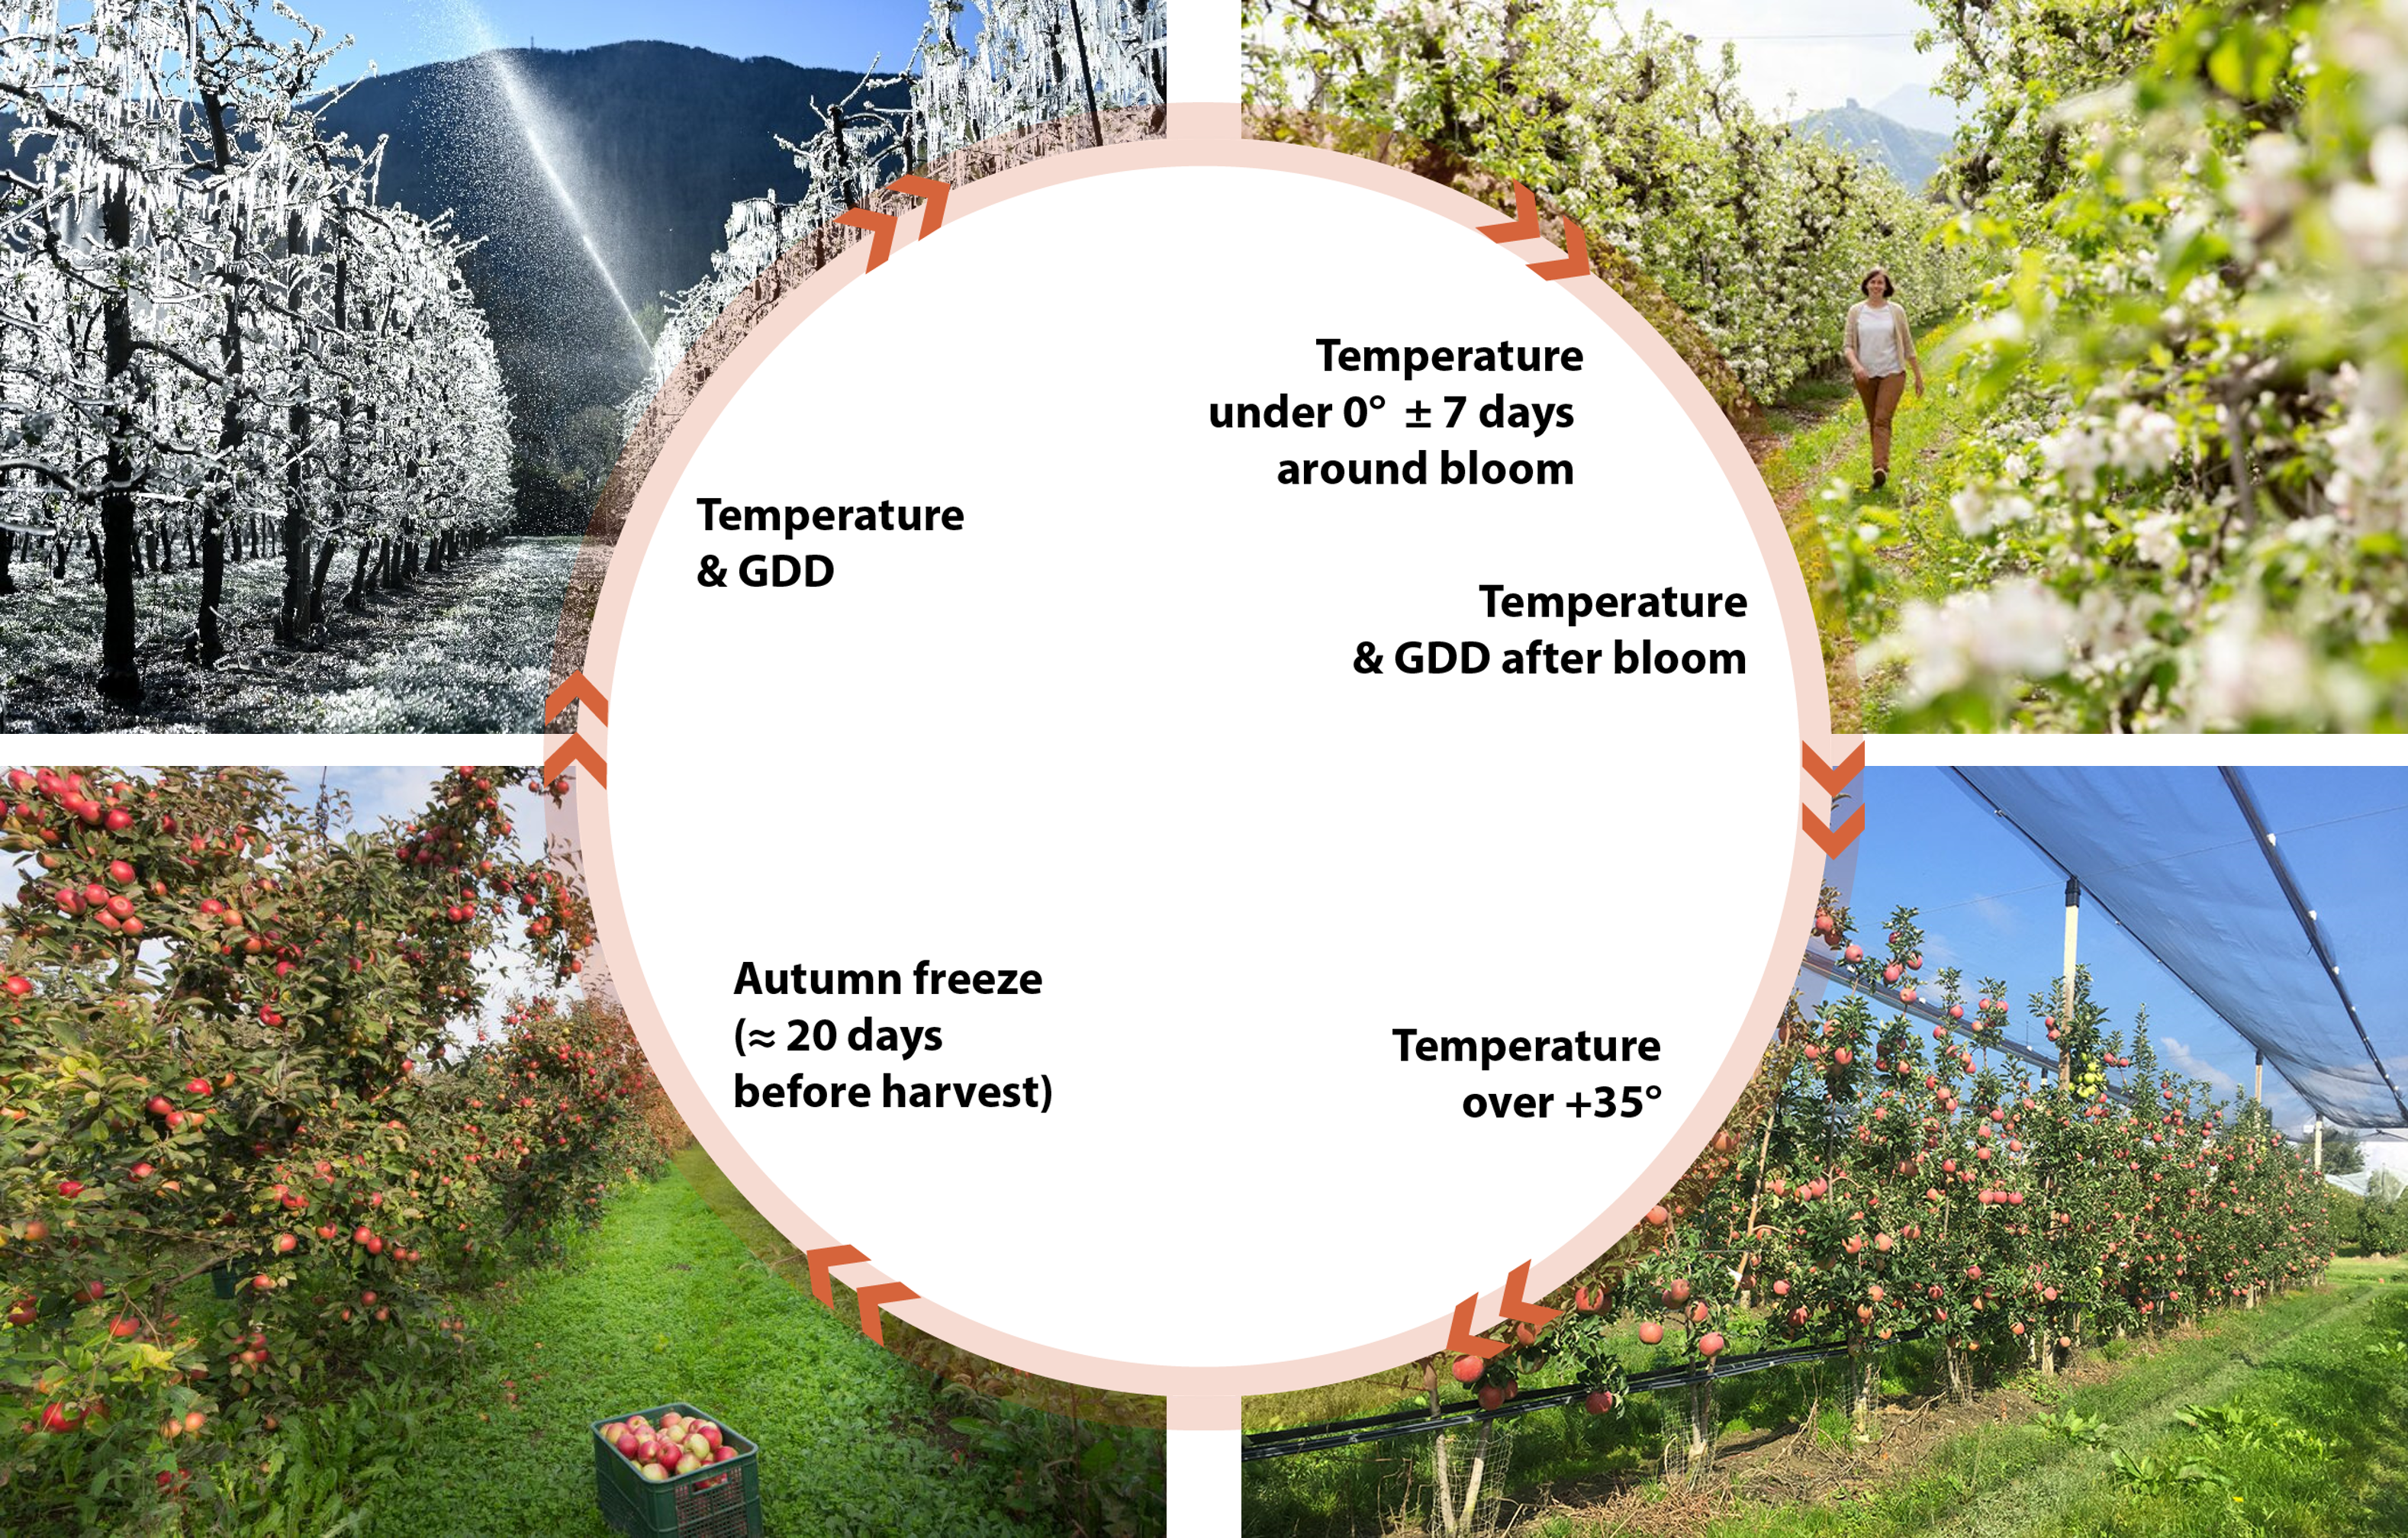
My objective was to develop a visual analytics tool to enhance the interpretability and utility of the historical apple variety data. This tool needed to not only provide a comprehensive overview of the apple varieties’ performance under different environmental conditions but also to enable the detailed examination of the interaction between specific climate events and variety performance. Specifically, there was a keen interest in understanding how extreme weather events, such as freezing temperatures and tropical heatwaves during summer, impact the quality and yield of different apple varieties. The aim was to support apple breeders and researchers in making informed, data-driven decisions by identifying varieties that are resilient or vulnerable to such climate extremes.
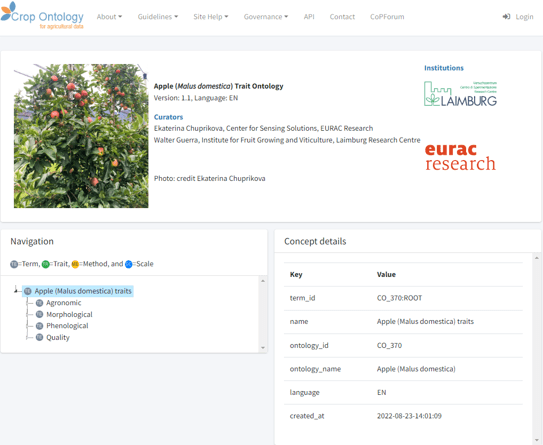
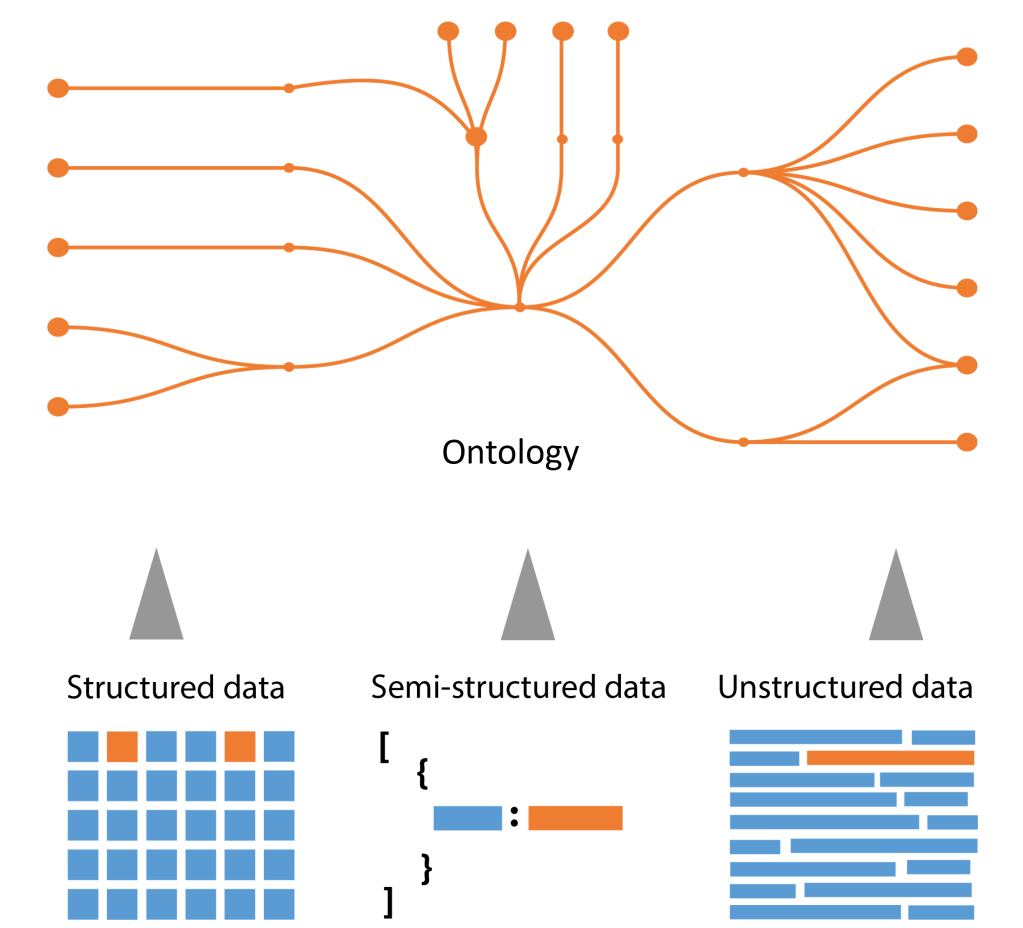
To address this, I initiated a comprehensive data pre-processing phase using R, which involved cleaning and standardizing the historical data for accuracy and consistency. I then implemented ontology-based data integration by creating an apple trait ontology, which I published as part of the Crop Ontology initiative. This ontology facilitated the structured integration of diverse data types and sources, enhancing the interpretability and utility of the data. Subsequently, the data was migrated from an Oracle DB to PostgreSQL, requiring several format transformations to maintain data integrity and compatibility.
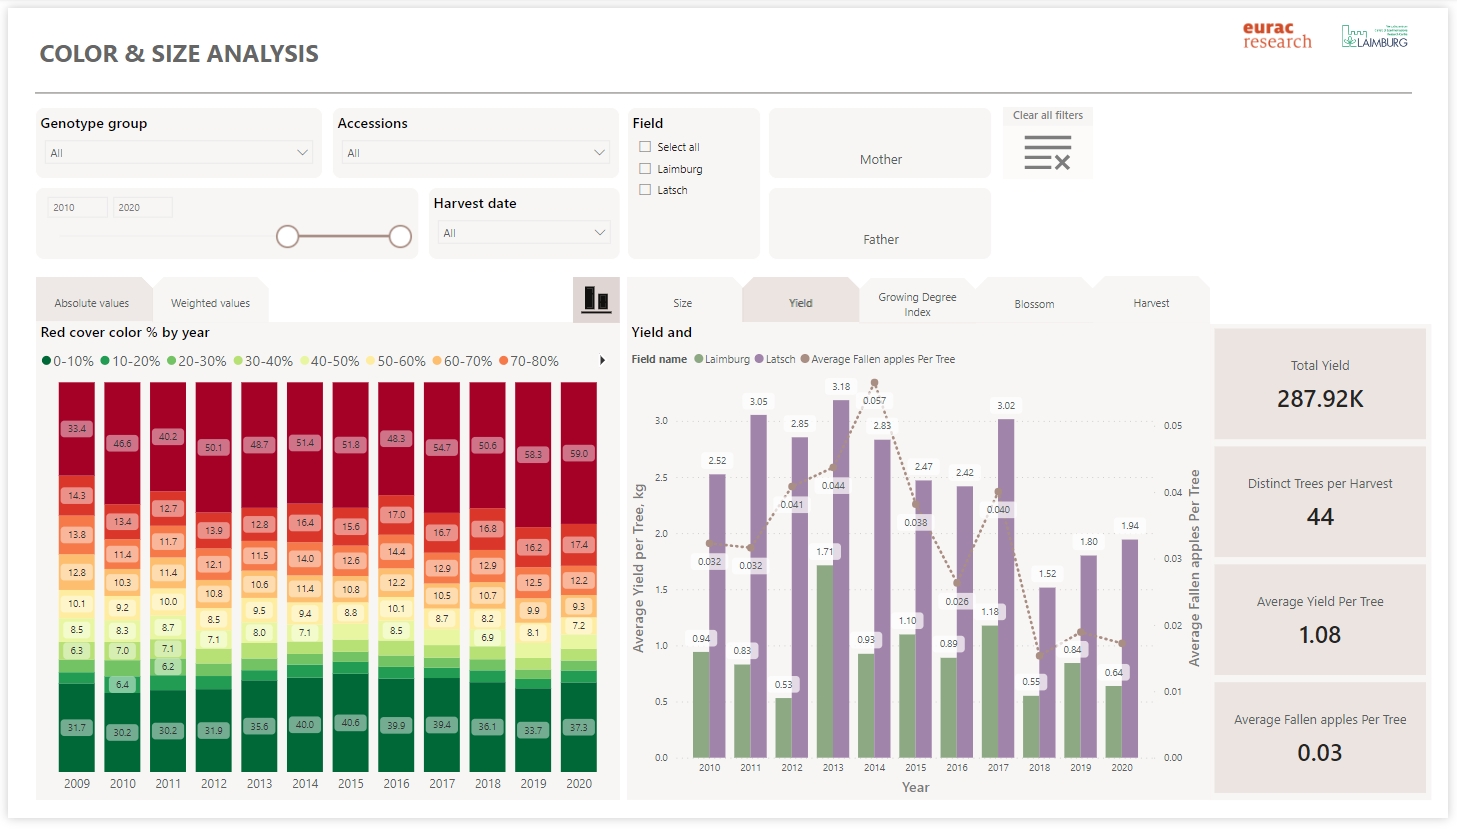
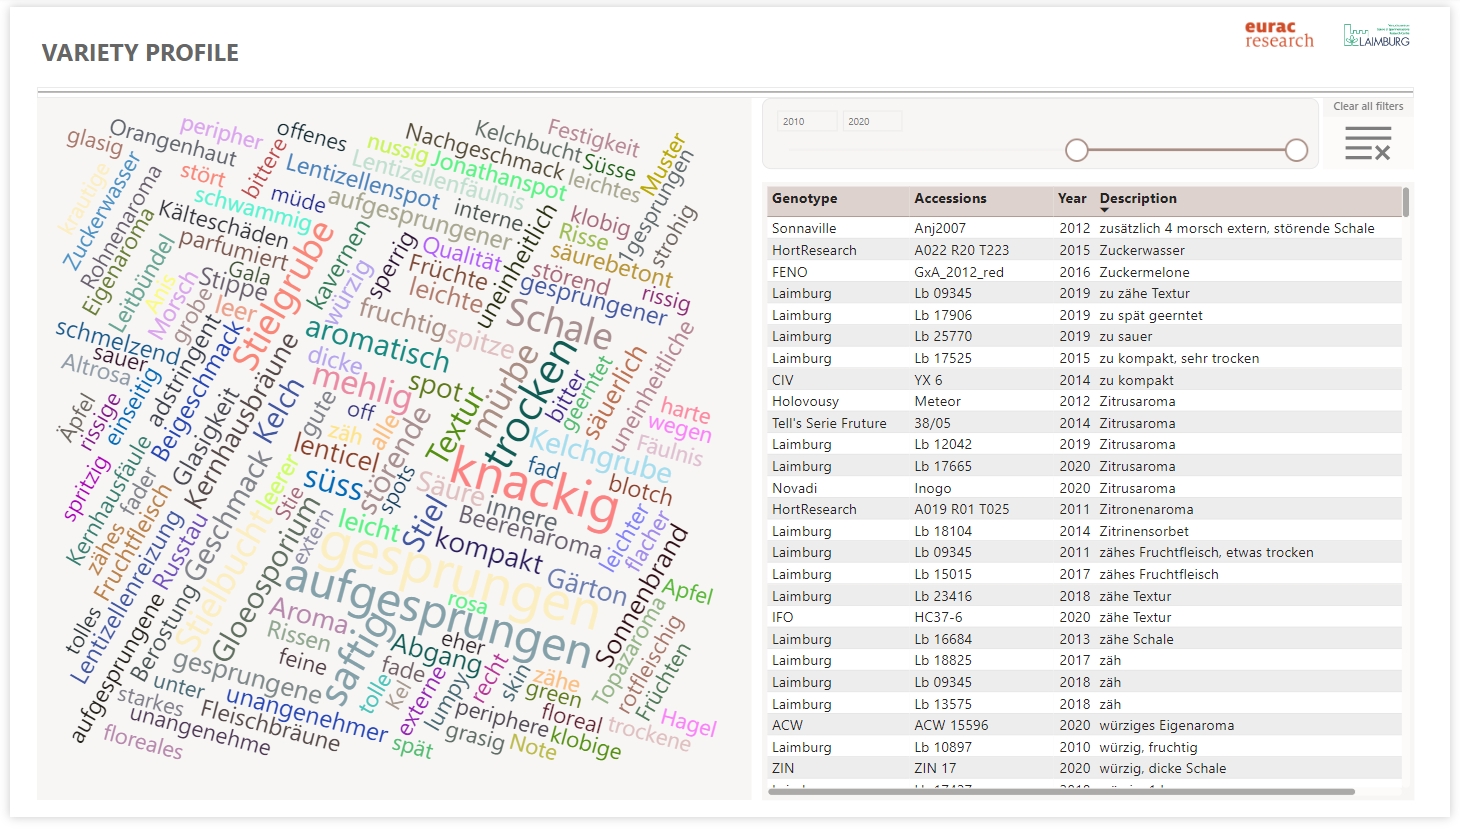
For the analytics and visualization, I employed Power BI to develop an interactive dashboard. This dashboard allows users to visualize the performance of apple varieties against a backdrop of historical climate data, enabling detailed analysis through filtering, trend exploration, and comparative assessments. The use of Power BI, known for its dynamic visualization capabilities, allowed for the creation of an intuitive and informative user interface that catered to the specific needs of apple breeders and researchers.
The deployment of the visual analytics dashboard marked a significant improvement over the existing database management and analysis methods. Apple breeders and researchers were now equipped with a tool that provided clear, actionable insights into the performance of various apple varieties in relation to changing climatic conditions. This tool has greatly facilitated data-driven decision-making, leading to more targeted breeding strategies and potentially more resilient and productive apple varieties. Feedback from users highlighted the dashboard’s effectiveness in simplifying complex data analysis and its role in streamlining the decision-making process for apple cultivation and breeding programs.
